Table of Contents
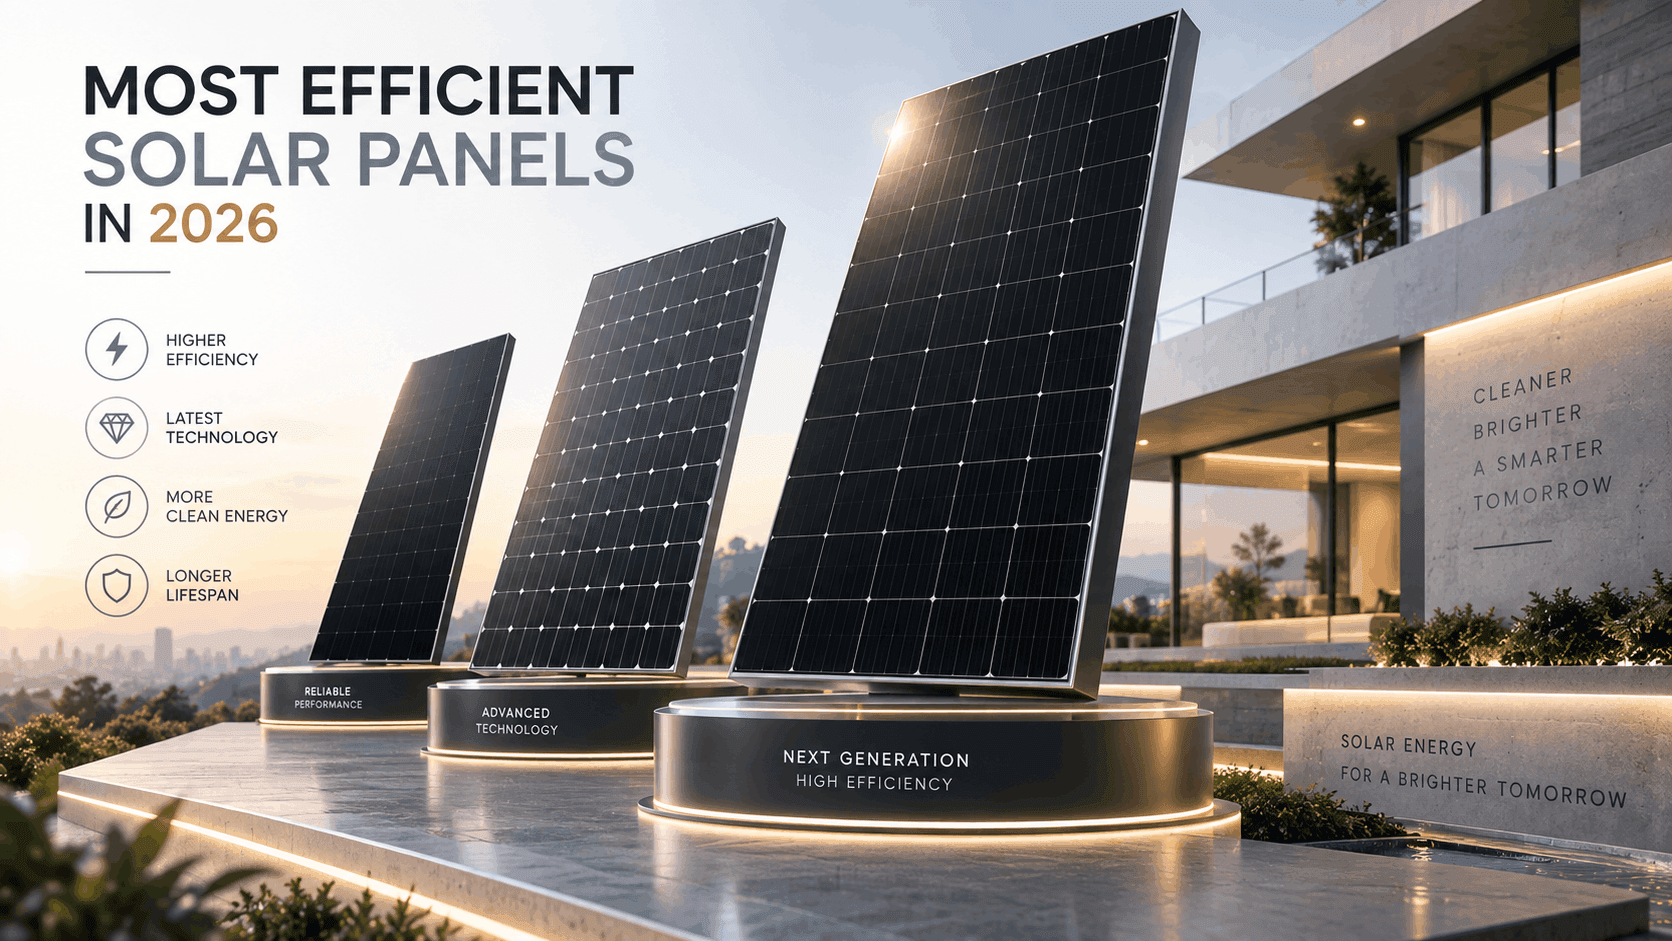
Efficiency numbers get thrown around a lot in solar marketing, and most of it is noise. But in 2026, one number is worth paying attention to: the best residential panels on the market now convert up to 25% of sunlight into electricity. Ten years ago, 15-18% was the ceiling for most panels sold to homeowners. That’s not a small jump.
Whether that number should actually change your buying decision is a different question, and it depends almost entirely on your roof, not on marketing copy. This guide covers who’s leading the efficiency race in 2026, what’s happening at the cell level to get them there, and when chasing the top spot on the leaderboard is worth the extra cost.
The short version: Aiko Solar currently sits at the top with its NEOSTAR 3P54 series, rated at 25.0% module efficiency using All Back Contact (ABC) cells. Recom Technologies is right behind at 24.8%, and LONGi Solar’s EcoLife series rounds out the top three at 24.3%.
What “Solar Panel Efficiency” Actually Means
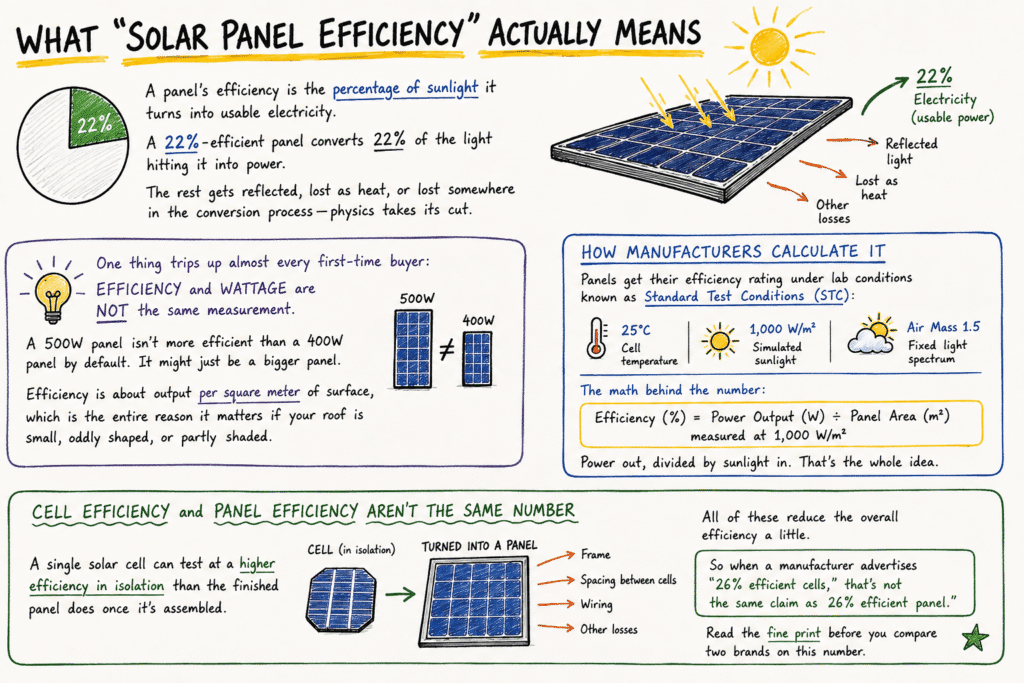
A panel’s efficiency is the percentage of sunlight it turns into usable electricity. A 22%-efficient panel converts 22% of the light hitting it into power. The rest gets reflected, lost as heat, or lost somewhere in the conversion process, physics takes its cut.
One thing trips up almost every first-time buyer: efficiency and wattage are not the same measurement. A 500W panel isn’t more efficient than a 400W panel by default. It might just be a bigger panel. Efficiency is about output per square meter of surface, which is the entire reason it matters if your roof is small, oddly shaped, or partly shaded.
How Manufacturers Calculate It
Panels get their efficiency rating under lab conditions known as Standard Test Conditions (STC): 25°C cell temperature, 1,000 W/m² of simulated sunlight, and a fixed light spectrum called Air Mass 1.5.
The math behind the number:
Efficiency (%) = Power Output (W) ÷ Panel Area (m²), measured at 1,000 W/m²
Power out, divided by sunlight in. That’s the whole idea.
Cell Efficiency and Panel Efficiency Aren’t the Same Number
This is where a lot of spec sheets get slippery. A single solar cell can test at a higher efficiency in isolation than the finished panel does once it’s assembled. Add the frame, the spacing between cells, and the wiring, and the overall number drops a little. So when a manufacturer advertises “26% efficient cells,” that’s not the same claim as “26% efficient panel.” Read the fine print before you compare two brands on this number.
Top Most Efficient Solar Panels in 2026 (Ranked)
Based on current manufacturer datasheets and independent industry tracking, here’s the leaderboard for residential-scale panels as of mid-2026:
| Rank | Brand | Model | Power | Efficiency | Cell Technology |
|---|---|---|---|---|---|
| 1 | Aiko Solar | NEOSTAR 3P54 | 500 W | 25.0% | Back-Contact (ABC) |
| 2 | Recom Technologies | Black Tiger Series | 495 W | 24.8% | Back-Contact |
| 3 | LONGi Solar | Hi-MO X10 / EcoLife | 495 W | 24.3% | HPBC (Back-Contact) |
| 4 | Maxeon | Maxeon 7 (Gen 7) | 445 W | 24.1% | Back-Contact (IBC) |
| 5 | JinkoSolar | Tiger Neo 3.0 | 520 W | 24.0% | N-Type TOPCon |
| 6 | Trina Solar | Vertex S+ | 475 W | 23.8% | N-Type TOPCon |
Look closely and a pattern shows up fast: back-contact designs occupy four of the top six spots. That’s not brand loyalty or marketing muscle at work, it comes down to where the wiring sits on the cell, which we’ll get into next.
One caveat worth repeating: this leaderboard has a shelf life. New certified records show up every few months, so treat this table as a snapshot, not gospel. We update it as new data lands.
The Technology Behind High-Efficiency Panels
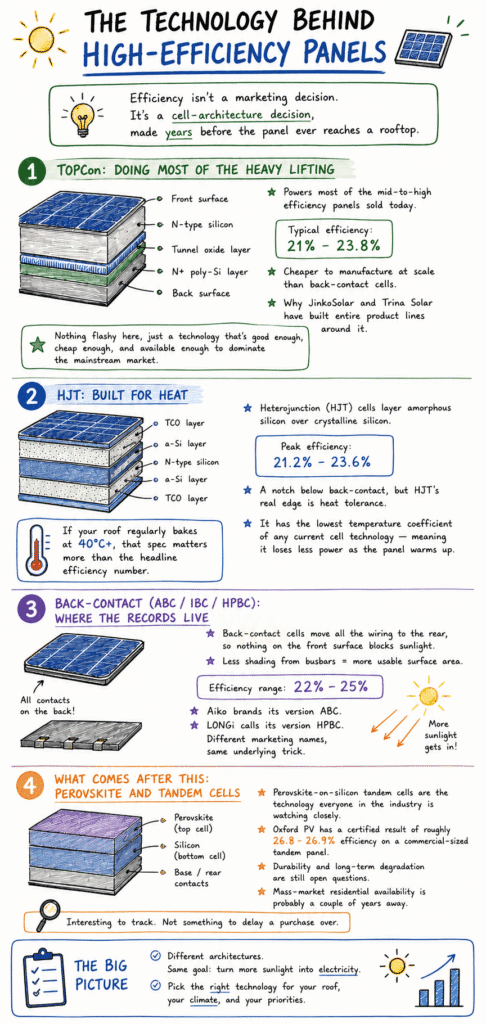
Efficiency isn’t a marketing decision. It’s a cell-architecture decision, made years before the panel ever reaches a rooftop.
TOPCon: Doing Most of the Heavy Lifting
TOPCon (Tunnel Oxide Passivated Contact) powers most of the mid-to-high efficiency panels sold today, typically landing between 21% and 23.8%. It’s cheaper to manufacture at scale than back-contact cells, which explains why JinkoSolar and Trina Solar have built entire product lines around it. Nothing flashy here, just a technology that’s good enough, cheap enough, and available enough to dominate the mainstream market.
HJT: Built for Heat
Heterojunction (HJT) cells layer amorphous silicon over crystalline silicon. Peak efficiency tops out around 21.2% to 23.6%, a notch below back-contact, but HJT’s real edge is heat tolerance. It has the lowest temperature coefficient of any current cell technology, meaning it loses less power as the panel warms up. If your roof regularly bakes at 40°C+, that spec matters more than the headline efficiency number.
Back-Contact (ABC / IBC / HPBC): Where the Records Live
Back-contact cells move all the wiring to the rear, so nothing on the front surface blocks incoming sunlight. Less shading from busbars translates directly into more usable surface area, which is exactly why back-contact panels currently occupy the 22% to 25% range at the top of the market. Aiko brands its version ABC. LONGi calls its version HPBC. Different marketing names, same underlying trick.
What Comes After This: Perovskite and Tandem Cells
Perovskite-on-silicon tandem cells are the technology everyone in the industry is watching closely. Oxford PV has a certified result of roughly 26.8-26.9% efficiency on a commercial-sized tandem panel. Durability and long-term degradation are still open questions, and mass-market residential availability is probably a couple of years away. Interesting to track. Not something to delay a purchase over.
Does Higher Efficiency Actually Matter for Your Roof?
It depends on the roof, not the panel. And this is the part most rankings skip entirely because it doesn’t fit neatly into a “top 10” format.
Small or Shaded Roofs: Efficiency Carries the Whole Decision
If roof space is tight, efficiency stops being a nice-to-have and becomes the deciding factor. A more efficient panel produces more power per square meter, which means fewer panels for the same system size, or a bigger system on a roof that otherwise couldn’t fit one.
Run the numbers and the gap is obvious. Twelve panels rated at 440W with 22.5% efficiency add up to 5,280W of total capacity. Twelve panels rated at 300W with 17.5% efficiency only reach 3,600W, same twelve panels, same roof space. That’s nearly 47% more power from an identical footprint.
Large, Open Roofs: Save the Money Instead
Plenty of unshaded roof area changes the math entirely. You can hit the exact same system size with more of a mid-efficiency panel, usually at a meaningfully lower price per watt. Premium efficiency panels typically carry a 30-40% price premium over standard options. If space was never the constraint, that premium buys you a number on a spec sheet and not much else.
Efficiency solves a space problem. If space isn’t your problem, you’re paying to fix something that was never broken.
Efficiency vs. Real-World Performance
A lab number is a starting point. Your roof will test it.
Temperature Coefficient: The Number That Ruins Summer
Every panel loses some output as it heats up past the 25°C test standard. The rate of loss is called the temperature coefficient, measured in %/°C — lower is better:
- Monocrystalline P-type: -0.35% to -0.40%/°C
- N-type TOPCon: -0.29% to -0.32%/°C
- N-type Back-Contact (IBC): -0.26% to -0.30%/°C
- N-type HJT: -0.25% to -0.27%/°C
Real rooftop cell temperatures often run 20-30°C hotter than the surrounding air. Two panels with identical efficiency ratings can end up producing noticeably different amounts of power once summer hits — the one with the better temperature coefficient wins, regardless of what the rated efficiency says on paper.
Degradation: What 25% Looks Like at Year 25
N-type cells, the kind used in most high-efficiency panels, tend to degrade slower than older P-type designs, sometimes as little as 0.25% per year. A lot of premium panels are warrantied to retain 90%+ of their original output after 25 years. None of that shows up in a headline efficiency figure, but it shows up on every electric bill for the next quarter-century.
Shading Wrecks Everything, Efficiency or Not
One shaded panel in a series-wired string can cut that entire string’s output by 50% or more. No efficiency rating fixes a chimney shadow that falls across the array for three hours a day. If shading is unavoidable on your roof, microinverters or power optimizers do more for your actual output than an extra percentage point of efficiency ever will.
Cost vs. Efficiency: Is the Premium Worth Paying?
| Factor | Standard Efficiency (~20-21%) | Premium Efficiency (23-25%) |
|---|---|---|
| Typical price premium | Baseline | 30-40% higher |
| Best suited for | Large, unshaded roofs | Small, shaded, or space-limited roofs |
| Long-term degradation | Slightly higher | Generally lower (N-type cells) |
| Fewer panels to install | No | Yes — lower install labor per watt |
High-efficiency panels generally outperform and outlast standard panels over their lifespan, mostly thanks to cell purity and slower degradation. The real question was never “which panel is objectively better.” It’s whether your specific roof needs what that premium buys.
Roof Space Calculator: How Many Panels Do You Actually Need?
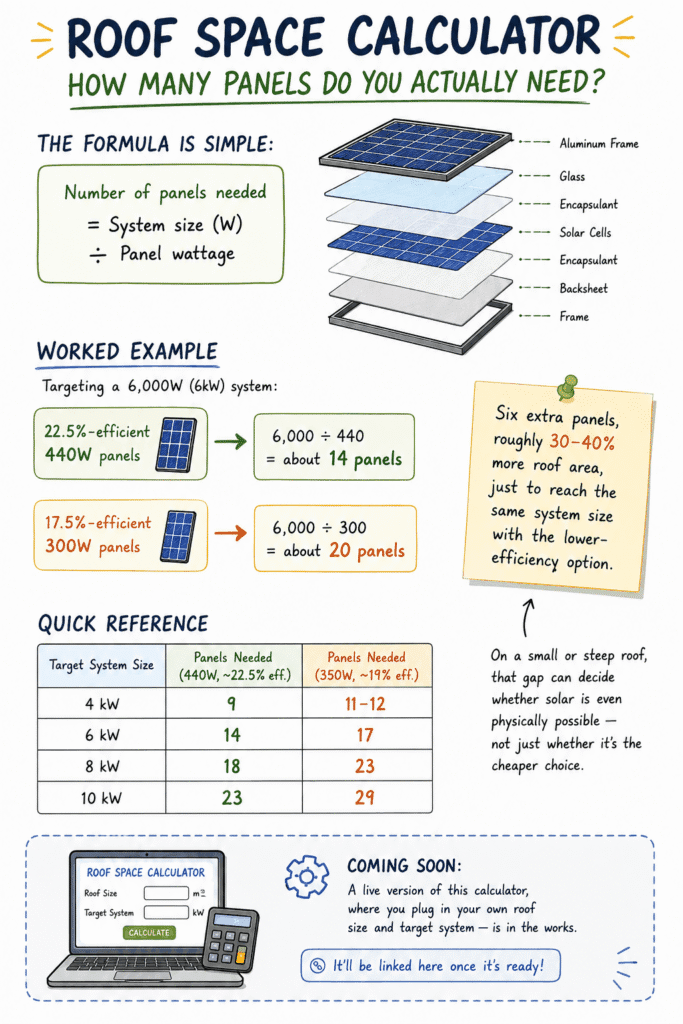
Skip the guessing. The formula is simple:
Number of panels needed = System size (W) ÷ Panel wattage
Worked example, targeting a 6,000W (6kW) system:
- With 22.5%-efficient, 440W panels: 6,000 ÷ 440 = about 14 panels
- With 17.5%-efficient, 300W panels: 6,000 ÷ 300 = about 20 panels
Six extra panels, roughly 30-40% more roof area, just to reach the same system size with the lower-efficiency option. On a small or steep roof, that gap can decide whether solar is even physically possible, not just whether it’s the cheaper choice.
Quick reference:
| Target System Size | Panels Needed (440W, ~22.5% eff.) | Panels Needed (350W, ~19% eff.) |
|---|---|---|
| 4 kW | 9 | 11-12 |
| 6 kW | 14 | 17 |
| 8 kW | 18 | 23 |
| 10 kW | 23 | 29 |
A live version of this calculator, where you plug in your own roof size and target system — is in the works. It’ll be linked here once it’s ready.
FAQs
What is the most efficient solar panel in 2026?
Aiko Solar’s NEOSTAR 3P54 leads the market at 25.0% module efficiency, built on back-contact cell technology.
What efficiency percentage counts as “good” for a solar panel?
Most residential panels sold today fall between 20% and 22%. Anything past 23% is generally marketed as premium or high-efficiency.
Does a higher efficiency rating mean a better-quality panel?
Not automatically. Efficiency measures power per square meter, it says nothing about manufacturing quality, warranty coverage, or how the panel holds up after a decade on a roof.
Is the extra cost of a high-efficiency panel worth it?
Usually, yes, if your roof space is limited or partly shaded. If you have room to spare, a mid-efficiency panel often makes more financial sense for the same system size.
What’s the real difference between TOPCon and HJT panels?
TOPCon balances efficiency and manufacturing cost well, which is why it’s the most widely produced N-type technology on the market. HJT costs more to produce but tolerates heat better, thanks to a lower temperature coefficient.