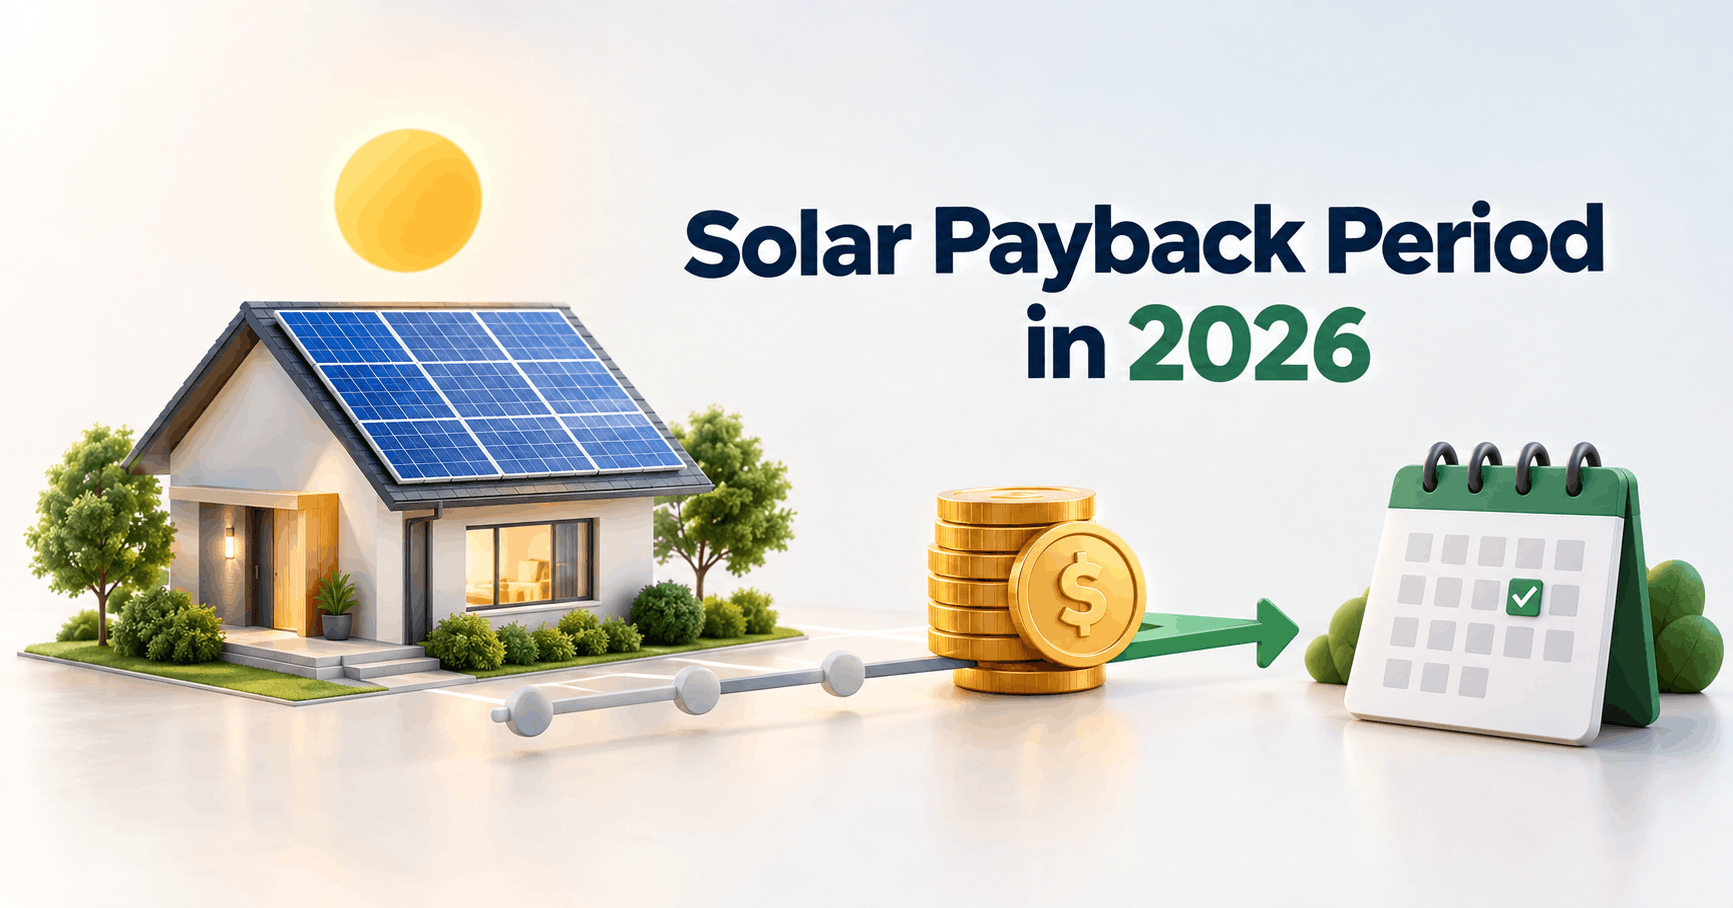
Quick Answer: Solar payback period is the time it takes for your electricity bill savings to equal what you paid for your solar system. In 2026, most U.S. homeowners who buy their own system break even in 8 to 12 years, up from the 5-to-7-year range common before the 30% federal tax credit expired in December 2025.
Table of Contents
For three years, every solar salesperson said the same thing: “You’ll break even in 5 to 7 years.” That number is dead. It died on December 31, 2025, when the 30% federal solar tax credit expired for homeowner-owned systems. Anyone still quoting you 5 to 7 years is either using old numbers or hoping you won’t ask questions.
Here’s the real one. The average U.S. residential electricity price sits at about 18 cents per kilowatt-hour in 2026, according to the U.S. Energy Information Administration (EIA). At that rate, most homeowners who buy their own solar system today — cash or loan, no lease, break even somewhere between 8 and 12 years. Not 5. Not 7. And that range still swings hard depending on where you live.
This guide walks through exactly why, with the math shown, not just asserted.
A quick note on how this was put together. Every number below traces back to a named source, the EIA, the Department of Energy, or the research teams at ConsumerAffairs. I didn’t run my own installer survey, and I’m not going to pretend I did. Where good sources disagree slightly, I’ll show you the range and explain why it’s wide instead of picking one number and hiding the rest.
Key Takeaways
- The national average solar payback period in 2026 is roughly 8 to 12 years for owner-financed systems, up from the 5-to-7-year figures common through 2024, mainly because the federal residential tax credit expired.
- The formula is simple: net system cost ÷ annual electricity savings = payback period, in years.
- Your local electricity rate matters more than your system size, your panel brand, or almost anything else.
- After payback, the electricity is essentially free for 15 to 20+ more years, that’s where the real money is made.
- Owned solar systems also tend to add resale value, separate from the energy savings.
What Is a Solar Payback Period?
Your solar payback period is the point where your electricity bill savings finally equal what you paid for the system. Before that point, you’re still in the red. After it, every kilowatt-hour your panels make is money in your pocket instead of money out.
It is not the same thing as your loan term. If you finance your system over 15 years but your payback period is 9 years, you start net-positive six years before the loan is even paid off, because the savings usually outpace the monthly payment.
It’s also not the same as total lifetime savings. Payback tells you when you break even. Lifetime savings tells you how much you make after that. Both matter, but they answer different questions, and a lot of sales pitches conveniently blur the two.
The Payback Formula (and a Real Worked Example)
The math isn’t complicated. Every credible source I checked, ConsumerAffairs, the Department of Energy, uses some version of this:
Net system cost ÷ annual electricity savings = payback period (in years)
Let’s run it with real 2026 numbers instead of hypothetical ones. ConsumerAffairs’ research team put the average U.S. residential solar system cost at $20,534 in 2026, with an average payback of 11.4 years. Do the reverse math and that implies average annual savings of roughly $1,800.
$20,534 ÷ $1,800 ≈ 11.4 years. That checks out.
I ran the same formula against other 2026 marketplace and state-level analyses, which peg average shopper breakeven at about 10 years, in a 9-to-12-year band nationally. Multiple independent data sets, different sample sizes, and the outputs still land in the same neighborhood.
What Actually Changed in 2026
his is the part most competitor articles skip or bury, and it’s the whole reason the “5 to 7 years” number stopped being true.
Under the One Big Beautiful Bill Act, the federal residential solar tax credit, officially Section 25D, worth 30% of your system cost with no cap, is no longer available for homeowner-owned systems installed after December 31, 2025. For over a decade, that credit was the single biggest lever shortening payback periods. Take it away, and the math simply gets longer.
To put it in real terms: on a $20,000 system, losing that 30% credit is the difference between financing $14,000 and financing the full $20,000. That alone can add two to four years to your payback period, depending on your electricity rate.
Third-party-owned systems, leases and power purchase agreements (PPAs), can sometimes still route through a separate commercial credit (Section 48E), because the leasing company technically owns the equipment. The rules there are different and change based on who holds title to the panels. This is exactly the kind of detail where a five-minute call with a licensed solar installer or your accountant saves you from a bad assumption. A generic online calculator can’t check your specific ownership structur, a real person can.
State and utility incentives are unaffected by this federal change. Net metering programs, state tax credits, and SRECs still work the same way they did in 2025, which is part of why your state matters so much (more on that below).
How Much Your State Changes the Number
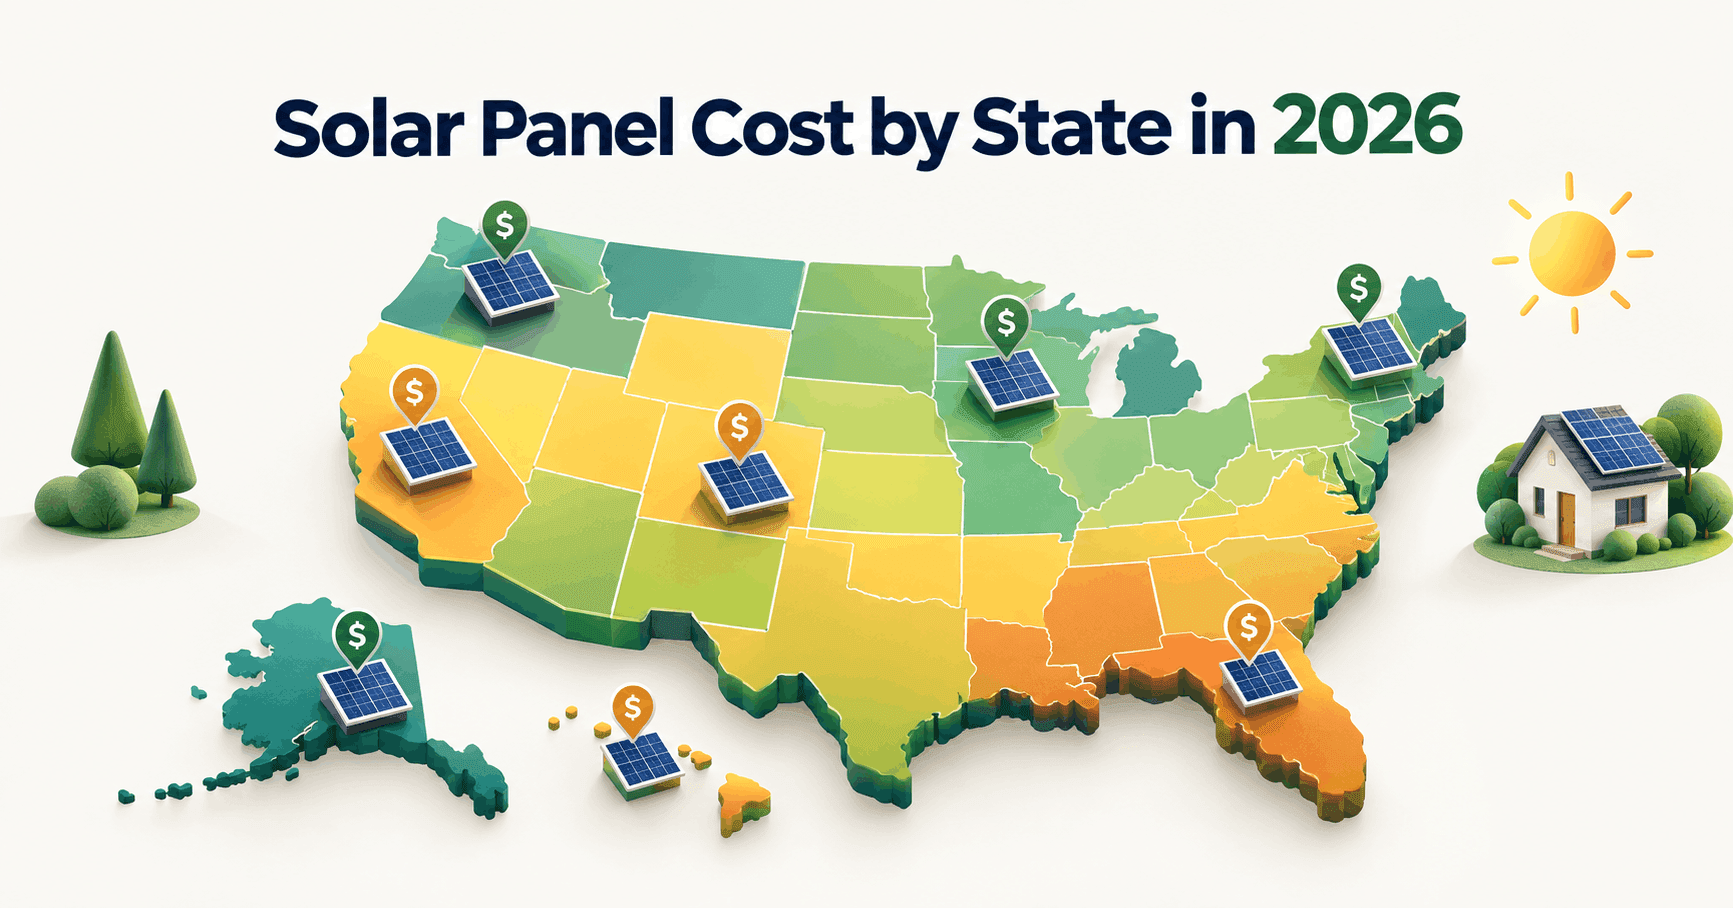
Your electricity rate is the single biggest variable in this whole calculation, and it varies enormously by state. According to EIA data, Hawaii’s average residential rate sits around 42 cents per kWh, more than three and a half times North Dakota’s roughly 12 cents per kWh.
That gap changes everything.Analysis of solar-shopper data found payback periods running as short as 5 years in high-rate states like Hawaii and Massachusetts, stretching out to 16 years or more in lower-rate states like Louisiana and North Dakota. Same panels, same formula, wildly different outcome, because the value of every kilowatt-hour you generate depends entirely on what the utility would have charged you for it.
If a quote doesn’t mention your state’s actual electricity rate, that’s a red flag, not a shortcut.
The 3 Factors That Move Your Number the Most (Ranked)
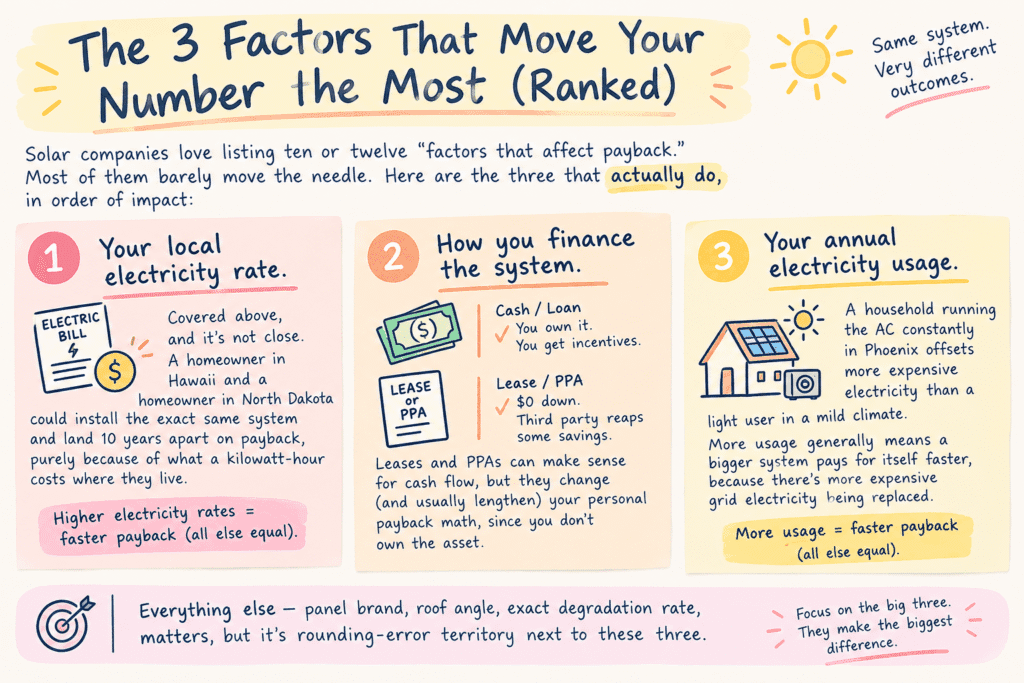
Solar companies love listing ten or twelve “factors that affect payback.” Most of them barely move the needle. Here are the three that actually do, in order of impact:
1. Your local electricity rate. Covered above, and it’s not close. A homeowner in Hawaii and a homeowner in North Dakota could install the exact same system and land 10 years apart on payback, purely because of what a kilowatt-hour costs where they live.
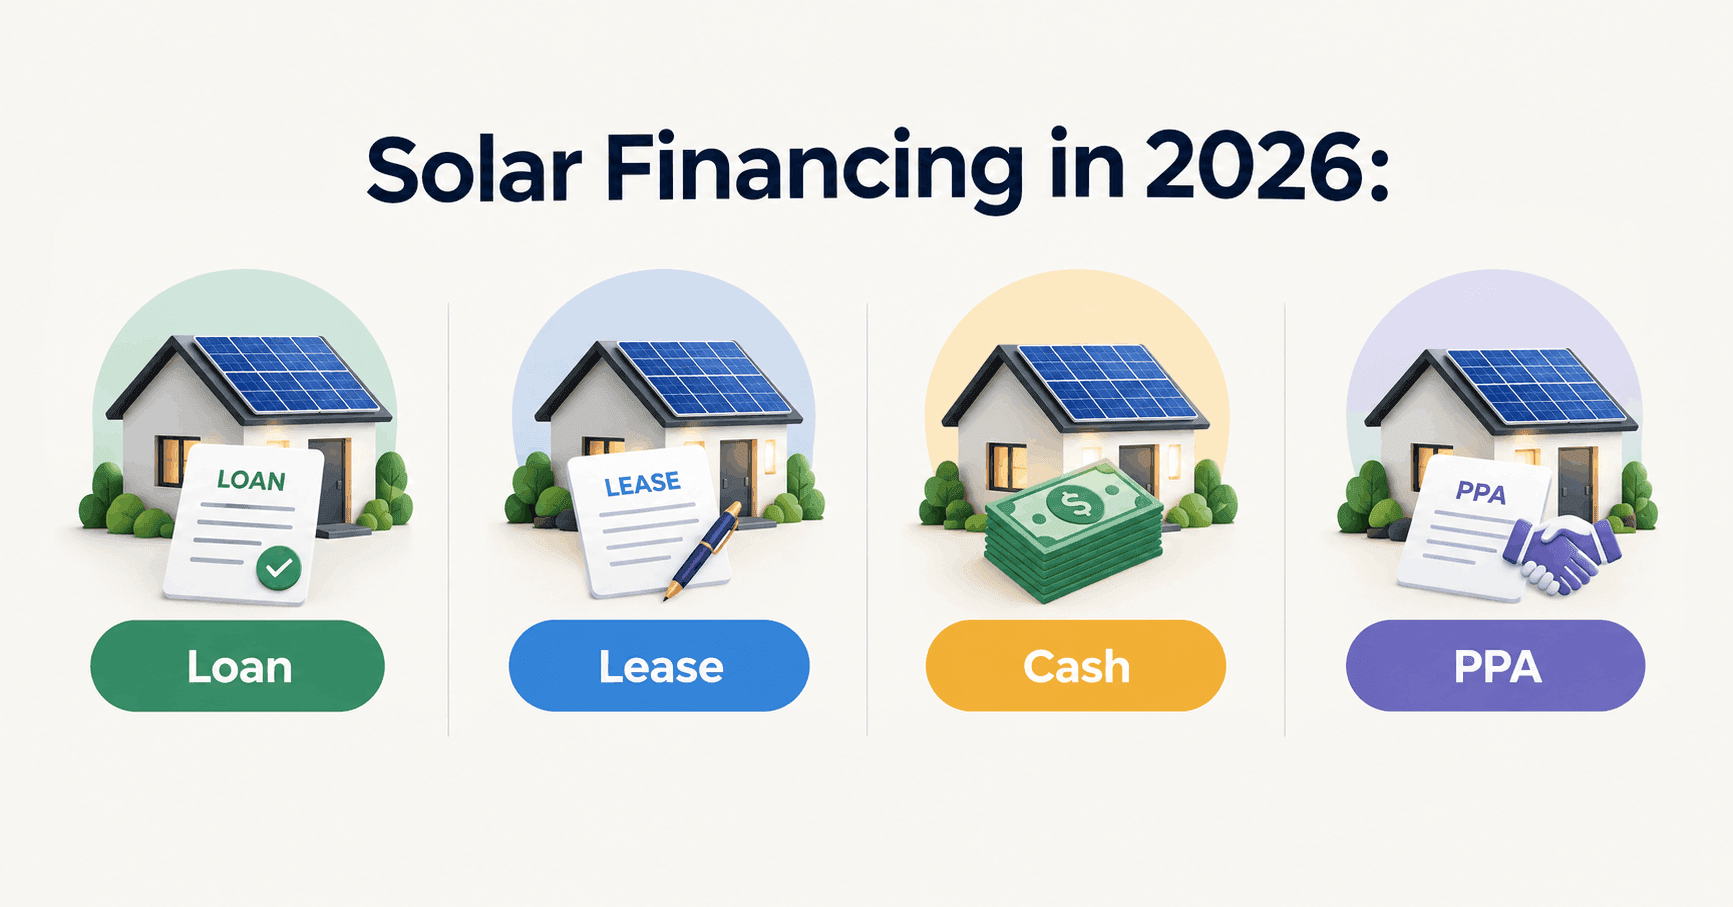
2. How you finance the system. Cash and loan purchases let you own the system and claim any incentives you still qualify for. Leases and PPAs hand a chunk of the savings to a third party in exchange for $0 down, which can make sense for cash flow, but it changes (and usually lengthens) your personal payback math, since you don’t own the asset.
3. Your annual electricity usage. A household running the AC constantly in Phoenix offsets more expensive electricity than a light user in a mild climate. More usage generally means a bigger system pays for itself faster, because there’s more expensive grid electricity being replaced.
Everything else, panel brand, roof angle, exact degradation rate, matters, but it’s rounding-error territory next to these three.
Simple Payback vs. Discounted Payback (The Part Everyone Skips)
Almost every solar article, including most of the big ones, stops at simple payback: cost divided by savings. That’s fine as a starting point, but it quietly assumes a dollar saved in year 12 is worth exactly the same as a dollar saved this year. It isn’t — inflation and opportunity cost both chip away at future dollars.
A discounted payback period accounts for that by applying a discount rate to future savings, the same way a financial analyst would value any long-term investment. Apply even a modest 5% annual discount rate to that ConsumerAffairs example above, and the 11.4-year simple payback stretches to somewhere in the 13-to-14-year range on a discounted basis. This is a simplified illustration, not a precise forecast, your real discount rate depends on your own assumptions about inflation and what else you’d do with the money.
Why mention it at all? Because “simple payback” alone makes solar look slightly better than it is, and this guide isn’t trying to sell you anything, just show you the real math.
Solar Payback vs. Other Places to Put Your Money
Nobody makes this comparison directly, so here it is. The S&P 500 has historically returned around 10% annually before inflation over long stretches, a widely cited, well-documented figure. A high-yield savings account in 2026 might pay somewhere in the 3-to-4% range.
Solar isn’t really an apples-to-apples comparison with either. It’s not liquid, you can’t sell a few panels if you need cash next month. It’s not diversified, your return depends entirely on one asset, on one roof, in one location. But the “return” isn’t taxed as income the way stock dividends often are, since it’s avoided cost, not earned cash. And unlike a savings account, your solar “return” tends to get better over time, since electricity rates almost always rise.
None of this makes solar objectively better or worse than investing elsewhere. It makes it a different kind of asset, and it’s worth treating the comparison honestly instead of pretending solar is either a slam-dunk or a scam.
The Home Value Bonus Nobody Calculates Into Payback

Here’s something most payback calculators leave out entirely: solar can add resale value on top of the energy savings, and that value shows up whether or not you’ve hit your breakeven point yet.
Zillow’s widely cited analysis found that homes with owned solar systems sell for about 4.1% more on average than comparable homes without one. Separately, researchers at Lawrence Berkeley National Laboratory, studying home sales across multiple states, found solar added measurable resale value on a per-watt basis, generally in the range of a few dollars per watt of installed capacity, varying meaningfully by state and market.
This only applies to owned systems. Leased panels and PPAs typically add little to nothing to resale value, since you don’t actually own the equipment being left behind.
Is 8 to 12 Years Actually Good?
It depends on what you’re comparing it to, but here’s a grounding fact: quality residential solar panels typically carry 25-year performance warranties, and many keep producing meaningfully beyond that. A 10-year payback on a system that runs for 25-plus years still leaves you 15+ years of essentially free electricity. That’s the part the “payback period” number alone doesn’t capture, it tells you when you stop losing money, not how much you eventually make.
Be skeptical of installer quotes promising 4-to-5-year paybacks in 2026 without a clear, itemized explanation of exactly which incentives you personally qualify for. With the federal credit gone for most homeowners, a number that low usually means someone is quietly using pre-2026 assumptions, or blending in savings from a battery or add-on that has its own, separate, and usually longer, payback timeline. A real advisor or installer should be able to show you the line-by-line math, not just hand you a final number.
FAQs
What is a good solar payback period in 2026?
Anything in the 8-to-12-year national range is normal and reasonable for an owned system. Under 8 years usually means a high electricity rate or strong state incentives; over 12 usually means a low electricity rate.
Does the federal solar tax credit still apply in 2026?
Not for homeowner-owned residential systems installed after December 31, 2025, that 30% credit (Section 25D) expired. Commercial and some third-party-owned systems may still access a related credit under different rules.
Does financing type affect my payback period?
Yes. Cash and loan purchases let you own the system and any incentives you qualify for. Leases and PPAs shift part of the value to the leasing company, which generally lengthens your personal payback math.
What happens after my payback period ends?
The electricity your system produces becomes essentially free, minus minor maintenance, for the remaining life of the system, often 15 to 20+ additional years.
Do solar panels add home value even before I break even?
Often, yes, for owned systems. Zillow’s research found roughly a 4.1% average resale premium, independent of where you are in your payback timeline.
Is solar still worth it without the 30% tax credit?
For a lot of homeowners, yes, especially in higher electricity-rate states, but the math is genuinely different than it was in 2024. It’s worth running your own numbers, or talking to a solar advisor, rather than assuming last year’s rules still apply.
Quick Glossary
Payback period — The time it takes for electricity bill savings to equal what you paid for your solar system.
Net metering — A billing arrangement where your utility credits you for excess electricity your panels send back to the grid.
ITC (Investment Tax Credit) — A federal tax credit for solar installation costs. The 30% residential version (Section 25D) expired December 31, 2025.
Discounted payback period — A version of the payback calculation that accounts for the fact that future savings are worth slightly less than savings today, due to inflation and opportunity cost.
Degradation rate — The rate at which a solar panel’s output slowly declines each year, typically less than 1% annually for quality panels.
PPA (Power Purchase Agreement) — A financing arrangement where a company owns the panels on your roof and sells you the electricity at a set rate, rather than you owning the system outright.
kW vs. kWh — kW (kilowatt) measures your system’s power capacity. kWh (kilowatt-hour) measures actual electricity used or produced over time. Your bill is measured in kWh; your system size is measured in kW.
Sources
- U.S. Energy Information Administration, Short-Term Energy Outlook, residential electricity price data
- ConsumerAffairs Research Team, 2026 average solar system cost and payback analysis
- Zillow, Solar home value research
- Lawrence Berkeley National Laboratory, Solar resale value studies across multiple states
This guide reflects publicly available data as of the update date below. Tax rules, state incentives, and electricity rates change, verify your specific numbers with a licensed installer, your utility, or a tax professional before making a purchase decision.