Quick Answer: Solar panels cost $2.25 to $3.30 per watt across most U.S. states in 2026, or roughly $19,500 to $34,000 for an average home system before incentives. The 30% federal tax credit expired December 31, 2025, for owned systems, so most homeowners now rely on state incentives and net metering to offset costs, with payback typically taking 6 to 12 years depending on local electricity rates.
Table of Contents
The myth first, because it matters
Most people start shopping for solar believing one thing: “I’ll get 30% off with the federal tax credit.”
That used to be true. It isn’t anymore, not if you’re buying your system with cash or a loan.
The 30% federal Residential Clean Energy Credit (Section 25D) expired on December 31, 2025. Congress passed the One Big Beautiful Bill Act (OBBBA) in July 2025, and it cut the credit nearly seven years early, with no phase-down period. If you own your system and install it in 2026, your federal credit is $0.
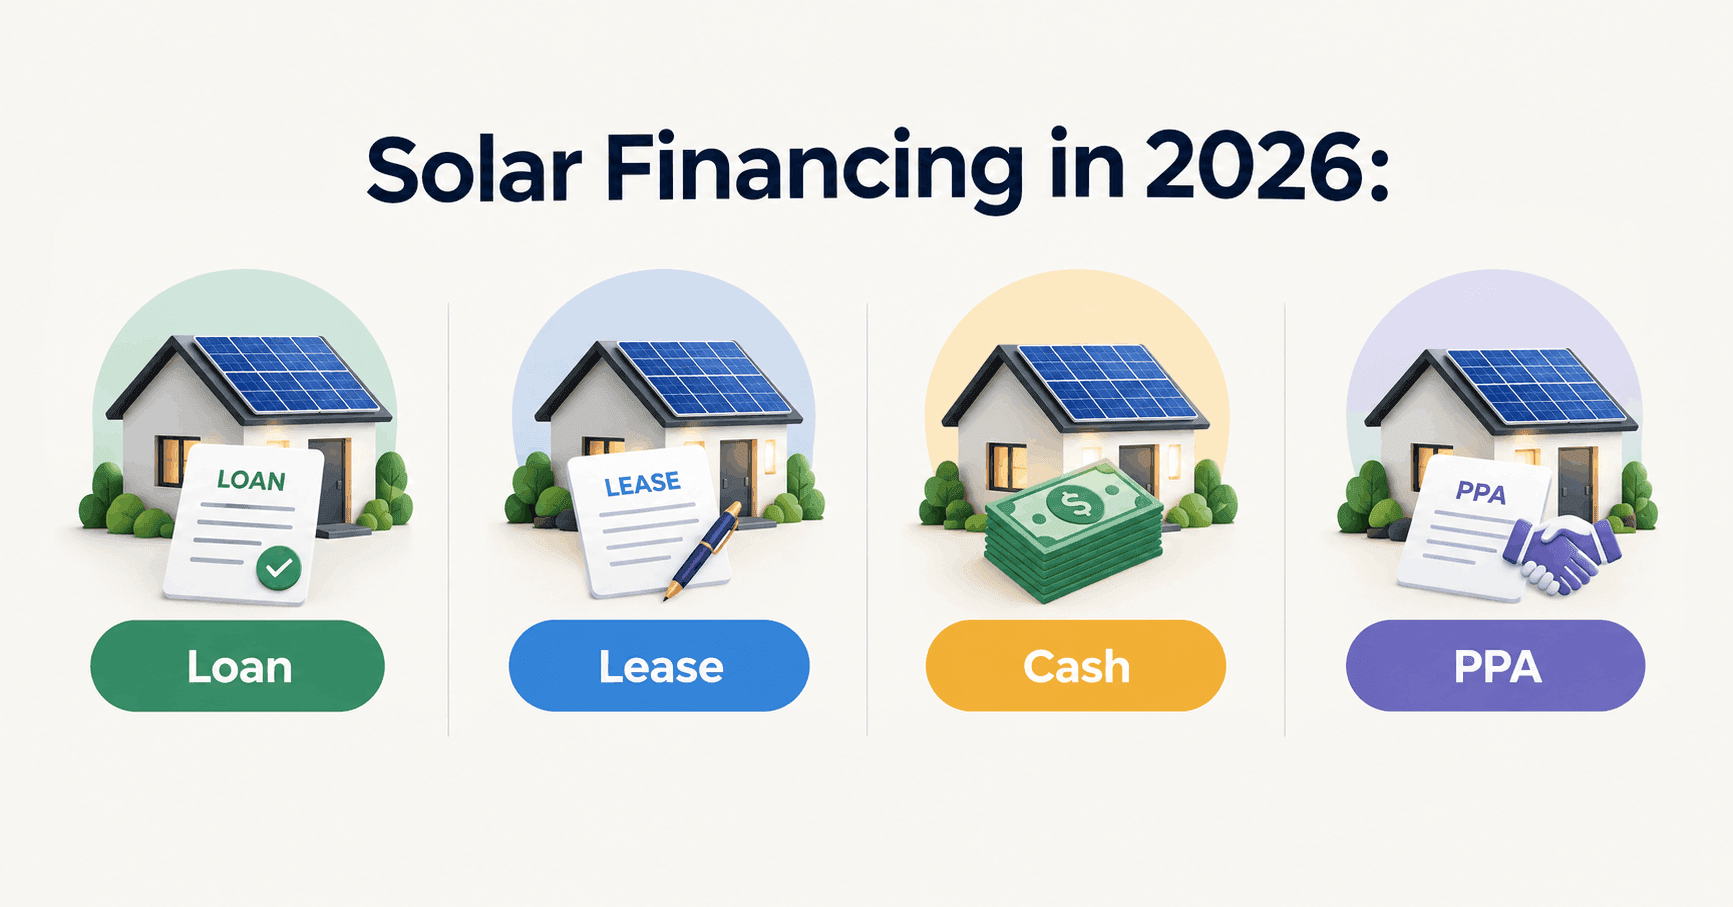
There’s one exception. If you lease your system or sign a power purchase agreement (PPA), the installer, not you, can still claim a federal credit through Section 48E, and some of that savings gets passed to you as a lower monthly payment.
I’m telling you this before a single price table, because half the “solar cost” guides online are quoting 2024 numbers with a tax credit that no longer applies to most homeowners. That’s not a small error. On a $30,000 system, that “credit” was worth $9,000.
Key Takeaways
- Average U.S. electricity now costs 18.34¢ per kWh, up 5% from last year.
- The 30% federal solar tax credit ended December 31, 2025, for owned systems.
- Solar system costs still range from about $2.25 to $3.30 per watt depending on your state.
- Typical payback period runs 6 to 12 years, depending mostly on your local electricity rate, not just your system price.
- Leased and PPA systems can still access a federal credit indirectly, owned systems cannot.
How I put this guide together
I’m not a solar installer. I’m a researcher, and I built this guide the way I’d want someone to build it for me: by pulling verified 2026 pricing from the two largest solar marketplaces in the country, cross-checking electricity rates against the U.S. Energy Information Administration, and confirming the tax credit situation against the actual legislative text reporting.
I did not estimate, guess, or average numbers to fill in gaps. Where I don’t have a verified number for a state, I say so, instead of inventing one. That’s a promise, not a disclaimer.
If you want a number specific to your roof, your utility, and your usage, a real conversation with a solar advisor will always beat any guide, including this one. I’ll point you toward that a few times, because a guide can get you 80% of the way there, but only a licensed advisor can look at your actual bill.
National averages, and what’s driving them up
Here’s the number that actually decides whether solar pays off for you: the average U.S. residential electricity rate is 18.34 cents per kWh as of September 2026, according to EIA data, up 5% year-over-year and up roughly 23% since 2022.
That matters more than the solar price tag. A $30,000 system in a state paying 30¢/kWh pays for itself far faster than the same system in a state paying 13¢/kWh, because you’re replacing more expensive electricity.
On the solar side, 2026 analysis (built on NREL, EIA, and Bureau of Labor Statistics data) puts the national average system at $3.03 per watt, or about $21,816 for a 7.2 kW system before any incentives.
For context on how far prices have already fallen: NREL data shows residential solar system costs dropped roughly 64% between 2010 and 2020. The steep part of the price curve is behind us, what moves the number now is mostly labor, permitting, and local incentives, not panel technology.
Solar panel cost by state: verified 2026 numbers
Cheapest states for solar, ranked

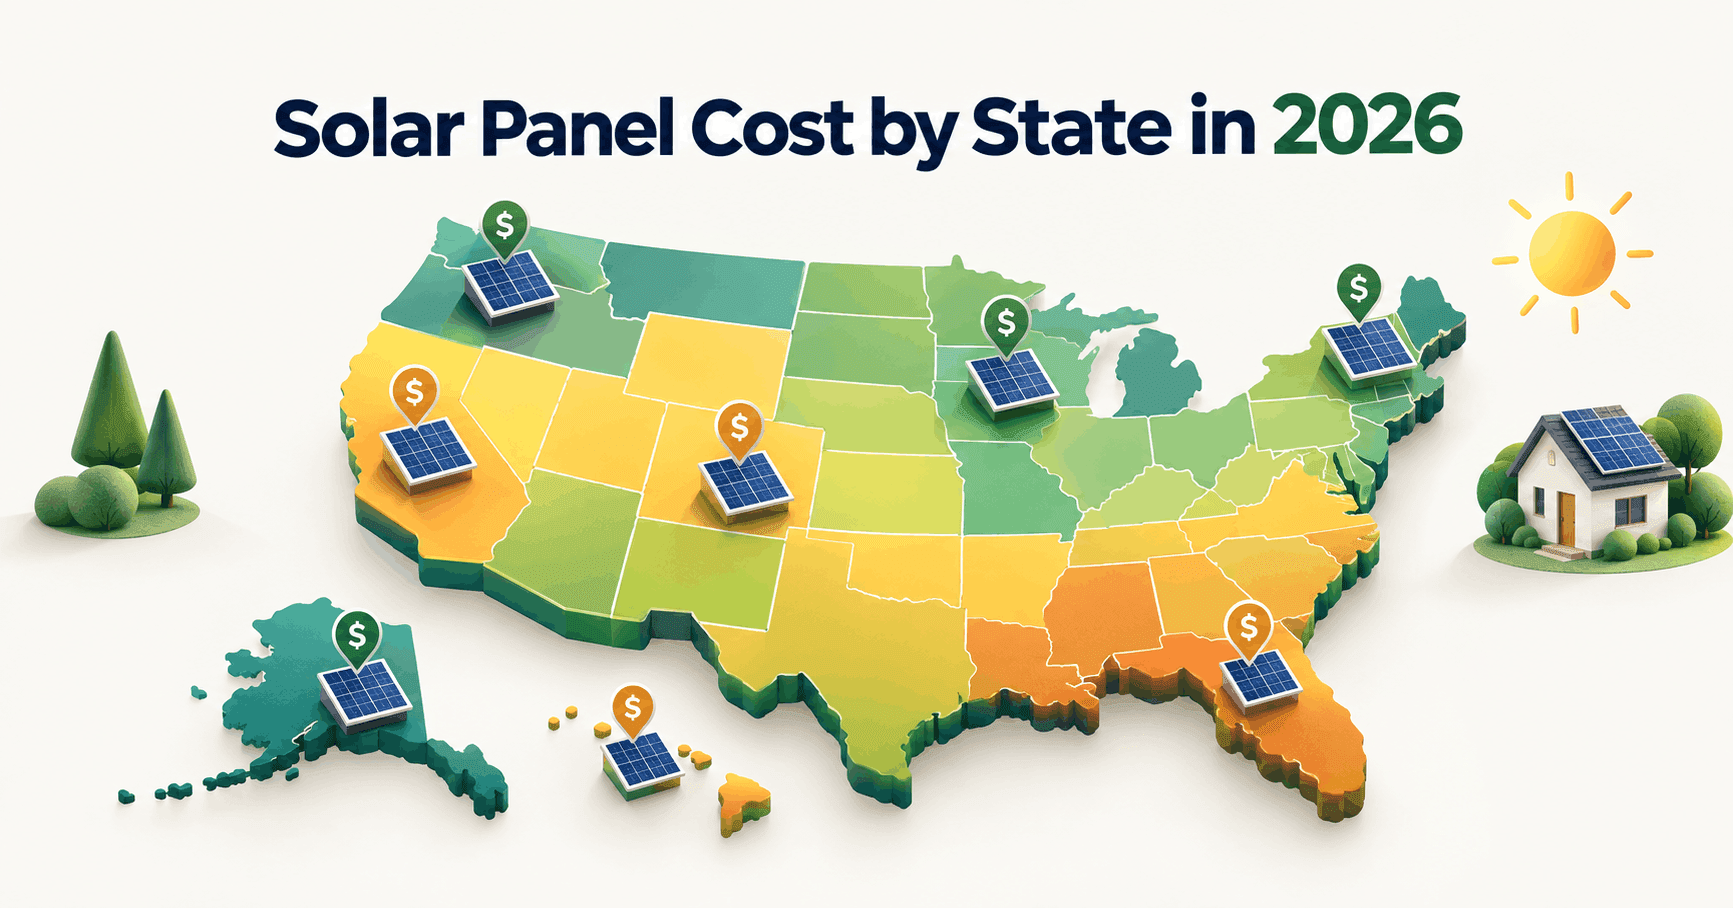
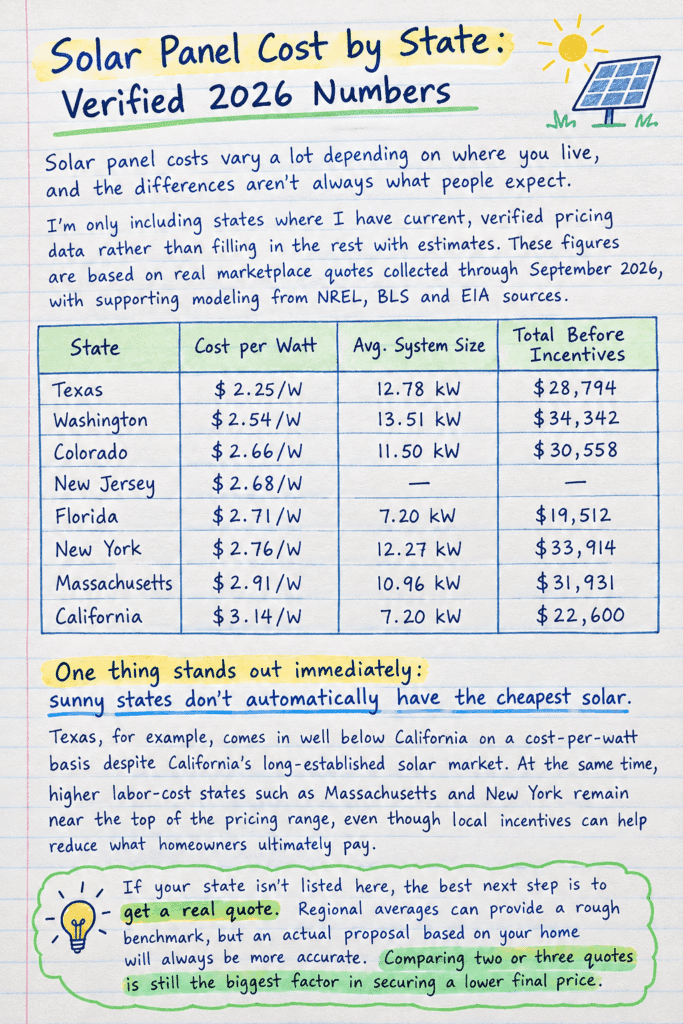
Based on verified per-watt data, here’s how the states I could confirm stack up, cheapest to most expensive:
- Texas: $2.25/W. Big open market, lots of installer competition, no state income tax to complicate things.
- Colorado: $2.66/W. Strong local incentive stacking helps offset a smaller pool of installers.
- New Jersey: $2.68/W. Dense market, high competition among installers.
- Florida: $2.71/W. Helped by a genuinely strong net metering policy, see the glossary if that term is new to you.
- New York: $2.76/W. Higher labor costs, partly offset by a state-level solar tax credit.
- Massachusetts: $2.91/W. Highest electricity rates on this list, which shortens payback even at a higher upfront price.
- California: $3.14/W. Highest labor costs in the country, but the most mature, experienced installer base.
Separately, marketplace analysis identifies Arizona as having the lowest overall solar costs nationally, with Nebraska and South Dakota running the highest, a pattern the company attributes to warmer states generally carrying lower labor and permitting costs.
Worth repeating: cheapest state doesn’t automatically mean best deal for you. A state with a low per-watt price but cheap electricity can have a longer payback than a pricier state with expensive electricity.
Why the federal tax credit ended, and what’s still on the table
Quick, no-spin version:
- The Inflation Reduction Act (2022) locked the 30% residential credit in through 2032, then a step-down to 26% and 22%.
- The One Big Beautiful Bill Act, signed July 4, 2025, repealed it outright, effective for any system placed in service after December 31, 2025.
- There’s no partial credit, no transition window. If your system wasn’t installed and operational by the end of 2025, you get nothing on the residential side.
What’s still available in 2026:
- State and utility incentives, these didn’t change and, in several states, are stronger than ever.
- Leases and PPAs, third-party-owned systems can still access a federal commercial credit (Section 48E) through the end of 2027, with the savings passed along as a lower monthly bill rather than a lump-sum credit to you.
- Net metering, a state-level policy, unaffected by the federal repeal.
If a salesperson is still advertising “30% off with the federal tax credit” on a cash or loan purchase in 2026, that’s outdated information at best.
How long until solar pays for itself
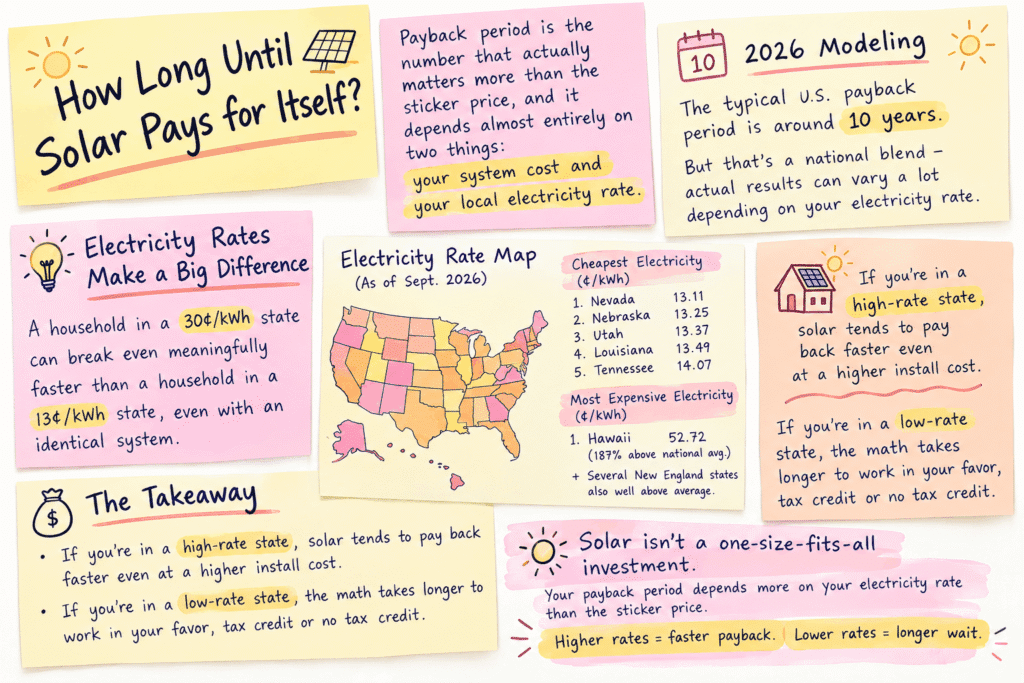
Payback period is the number that actually matters more than the sticker price, and it depends almost entirely on two things: your system cost and your local electricity rate.
2026 modeling puts the typical U.S. payback period at around 10 years. But that’s a national blend, a household in a 30¢/kWh state can break even meaningfully faster than a household in a 13¢/kWh state, even with an identical system.
That’s also why the electricity rate map matters as much as the solar price map. As of September 2026:
- Cheapest electricity: Nevada (13.11¢/kWh), Nebraska (13.25¢), Utah (13.37¢), Louisiana (13.49¢), Tennessee (14.07¢).
- Most expensive electricity: Hawaii (52.72¢/kWh, 187% above the national average), with several New England states also well above average.
If you’re in a high-rate state, solar tends to pay back faster even at a higher install cost. If you’re in a low-rate state, the math takes longer to work in your favor, tax credit or no tax credit.
What you’re actually paying for
A solar quote isn’t just “panels.” Roughly, a typical residential system breaks down into:
- Panels and inverter, the hardware itself
- Labor and installation, mounting, wiring, roof work
- Permitting and inspection, varies enormously by city and county
- Interconnection, the paperwork and hardware to legally connect to the grid
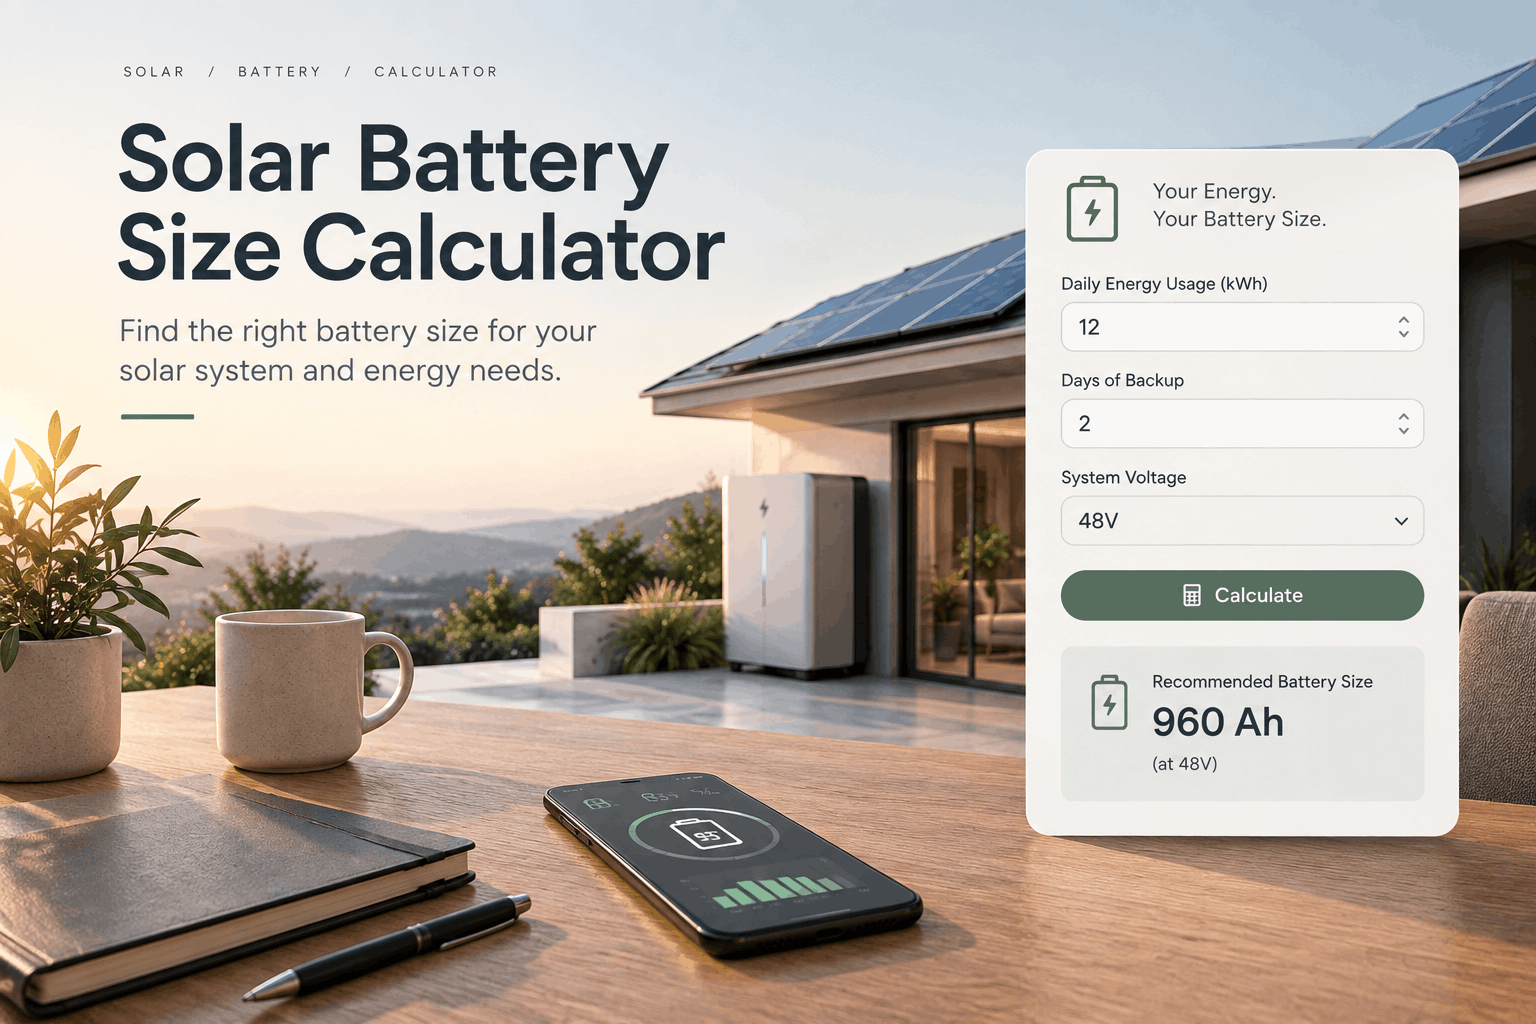
- Optional battery storage, not required, but increasingly common, especially since batteries lost their federal credit too
Bigger systems cost more per watt, but somewhat less per watt as size increases, because fixed costs like permitting spread across more panels. It’s not a linear relationship, so a “cost per watt” number for a 5 kW system and a 15 kW system won’t match exactly.
Glossary: the terms you’ll keep running into
$/W (cost per watt) — The standard way to compare solar quotes of different sizes. Total system cost divided by system size in watts.
kW (kilowatt) / kWh (kilowatt-hour) — kW measures system capacity; kWh measures energy actually used or produced over time. Your electric bill is priced in kWh.
Net metering — A policy that credits you for excess solar electricity you send back to the grid, usually at or near the retail rate. States without strong net metering see slower solar payback.
ITC / Section 25D — The federal Investment Tax Credit for residential solar, expired for owned systems after December 31, 2025.
Section 48E — The federal commercial credit that leased and PPA solar systems can still access through 2027.
PPA (Power Purchase Agreement) — An arrangement where a third party owns the panels on your roof and sells you the electricity, usually at a lower rate than your utility.
Payback period — The number of years it takes for electricity bill savings to equal what you spent on the system.
FAQs
Is the federal solar tax credit really gone in 2026?
For owned systems purchased with cash or a loan, yes, it expired December 31, 2025. Leased and PPA systems can still access a federal credit indirectly.
Which state has the cheapest solar panels?
Among the states with verified 2026 data, Texas leads at $2.25/W. Marketplace data points to Arizona as the lowest nationally.
Does a lower cost per watt mean a better deal?
Not necessarily. A state with cheap solar but cheap electricity can have a slower payback than a state with pricier solar and expensive electricity. Check both numbers.
How much does the average solar system cost in 2026?
Around $21,816 for a 7.2 kW system before incentives, national modeling, or $2.25 to $3.30 per watt depending on your state.
Should I lease or buy solar in 2026, now that the tax credit is gone?
That depends on your finances, how long you plan to stay in the home, and your state’s incentives, this is exactly the kind of decision worth a conversation with a solar advisor rather than a blanket answer.
Summary
Solar still makes financial sense in most states in 2026, rising electricity rates are doing some of the work the tax credit used to do. But the math changed in January 2026, and a lot of the content still online hasn’t caught up.
Get real numbers for your address, not a state average, before you sign anything. A solar advisor can run your actual roof, your actual utility rate, and your actual usage, this guide can only get you in the right neighborhood.
This article covers general U.S. averages and a subset of states with verified 2026 pricing. It is not tax or financial advice — confirm your specific situation with a licensed tax professional or solar advisor.